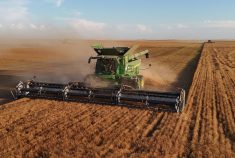
MarketsFarm — New stats show larger soybeans and corn stocks in Canada as of July 31 when compared to the same time last year.
Statistics Canada issued its updated report on stocks of grain and oilseeds on Tuesday morning.
The federal agency said combined farm and commercial stocks of corn rose by over 29 per cent, going from 1.98 million tonnes on July 31, 2019 to 2.56 million the following year. Soybeans were up three per cent, from 700,000 tonnes at the end of July 2019 to 721,000 as of July 2020.
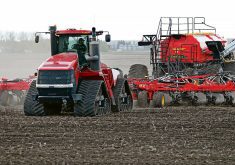
On-farm stocks of corn increased, going from 1.08 million tonnes in July 2019 to 1.99 million tonnes in July 2020. For soybeans, on-farm stocks also increased, from 95,000 tonnes to 196,000.
Read Also

USDA attachés forecast some changes in China’s oilseeds, cereals
As China heads into the 2026/27 marketing year, the United States Department of Agriculture attachés in Beijing projected a few minor to moderate changes in the country’s soybean, canola, corn and wheat crops.
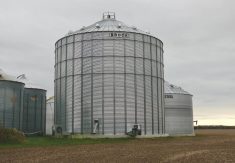
In the commercial pipeline, corn stocks dropped from 903,000 in July 2019 to 566,000 this past July. Soybean stocks were lower as well, from 604,000 tonnes a year ago to 525,000 in July 2020.
Unlike most crops in Canada with a marketing year from Aug. 1 to July 31, the year for corn and soybeans runs Sept. 1 to Aug. 31.
Table: Canadian farm and commercial stocks in thousands of tonnes. Source: Statistics Canada.
| Crop | 2019 | 2020 | Difference (%) |
| Durum | 1,832 | 737* | -59.8 |
| Wheat | 4,209. . | 4,763* | +13.2 |
| All wheat. . | 6,041 | 5,499*. . | -9.0 |
| Barley | 863 | 957 | +10.9 |
| Oats | 397 | 426 | +7.3 |
| Corn | 1,979 | 2,560 | +29.4 |
| Canola | 4,435 | 3,131* | -29.4 |
| Flax | 60 | 64 | +6.7 |
| Soybeans | 700 | 721 | +3.0 |
| Lentils | 856 | 209* | -75.6 |
| Dry peas | 312 | 233 | -25.3 |
* – Numbers revised from previous Statistics Canada report.