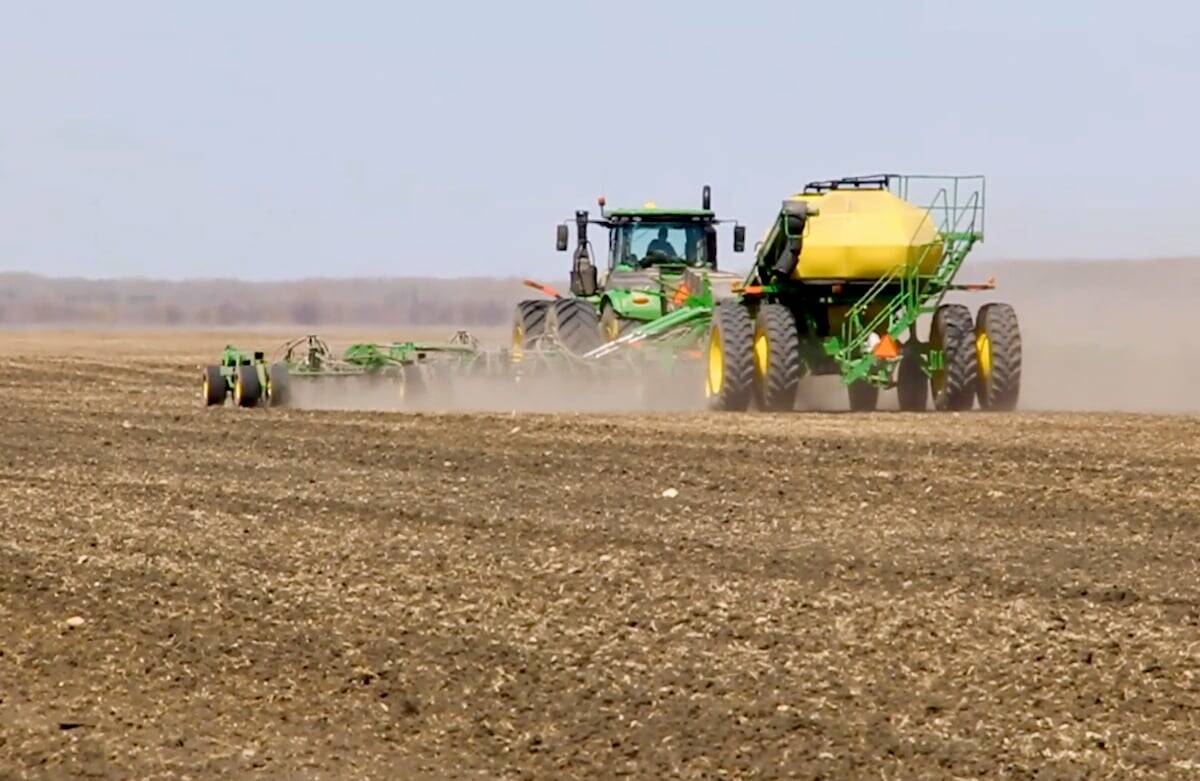
Glacier FarmMedia — Canadian farmers will plant more canola in 2026/27, while lowering their pulse and special crop area, according to the first supply/demand estimates from Agriculture and Agri-Food Canada for the upcoming marketing year, released Jan. 21. Production for most Western Canadian crops is expected to be down on the year, given a return to average yields. Meanwhile, corn and soybeans are forecast to see production increases.
Crop rotations, moisture conditions, price expectations and input costs/availability will be the main factors determining seeding decisions, said AAFC. “Additionally, heightened uncertainty surrounding international trade is expected to play a role in shaping planting strategies this year,” said the government agency.
Read Also
Klassen: Western Canadian feeder market incorporates risk discount
For the week ending March 7, Western Canadian feeder cattle markets traded $5-$10/cwt lower compared to seven days earlier. The…
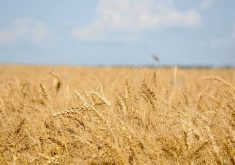
Wheat
- Wheat area is projected to decrease 0.3 per cent, at 10.937 million hectares. Of that total, durum area is expected to decline to 2.461 million hectares, from 2.643 million in 2025/26, while other wheat will increase 2.2 per cent to 8.476 million hectares.
- A return to average yields would see total wheat production down 12.5 per cent on the year, at 34.979 million tonnes.
- Wheat ending stocks are forecast to dip to 5.700 million tonnes by the close of the 2026/27 marketing year, which compares with an estimated carryout of 7.5 million tonnes projected for 2025/26.
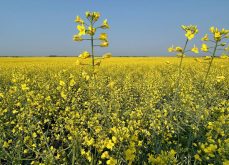
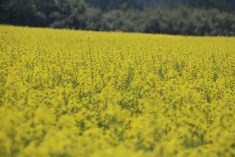
Canola
- Planted canola area is forecast to be up 1.9 per cent on the year, at 8.915 million hectares.
- However, production is forecast to decline to 19.200 million tonnes from the record 21.804 million tonnes grown in 2025/26 given a return to average yields.
- AAFC raised its call for 2025/26 canola exports to 8.200 million tonnes, from an earlier estimate of 8.000 million tonnes. Exports for 2026/27 were forecast at 7.500 million tonnes.
- Canola ending stocks were estimated at 2.750 million tonnes for the current marketing year and 1.650 million tonnes in 2026/27.
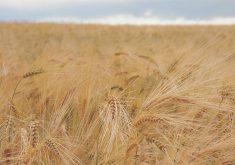
Barley/Oats
- Barley area is forecast to increase 6.1 per cent on the year, to 2.635 million hectares, while total production will dip to 8.450 million tonnes from 9.725 million tonnes the previous year.
- Oats area is projected to increase by 1.8 per cent, at 1.235 million hectares, with production down 9.4 per cent at 3.550 million tonnes.
Peas/Lentils
- Area planted to peas is forecast to be down 15.5 per cent, at 1.200 million hectares, while lentils are forecast to see a 9.7 per cent reduction in seeded area.
- Pea production is forecast to be down by 1.1 million tonnes on the year, at 2.850 million tonnes. Lentil production is expected to see a similar cut to production, at 2.250 million tonnes.
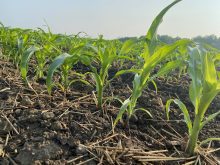
Soybeans/Corn
- A return to average yields in Eastern Canada, after hot and dry conditions hurt corn and soybean yields in 2025/26, is forecast to result in increased production for the two crops.
- Soybean area is forecast to increase by 2.6 per cent, at 2.401 million hectares, with production rising to 7.600 million tonnes from 6.793 million tonnes in 2025/26.
- While corn area is expected to be down by 0.7 per cent, at 1.520 million hectares, the early call from AAFC is for production to rise to 15.200 million tonnes from 14.867 million in 2025/26.
| Grains and oilseeds | |||||||
| Production | Exports | ||||||
| 2026/27 | 2025/26 | 2024/25 | 2026/27 | 2025/26 | 2024/25 | ||
| Jan | Jan | ||||||
| All wheat | 34.979 | 39.955 | 35.939 | 28.500 | 28.550 | 29.220 | |
| Durum | 5.668 | 7.135 | 6.380 | 5.300 | 5.350 | 5.821 | |
| Barley | 8.450 | 9.725 | 8.144 | 3.040 | 3.240 | 2.843 | |
| Corn | 15.200 | 14.867 | 15.345 | 2.000 | 2.000 | 2.776 | |
| Oats | 3.550 | 3.920 | 3.358 | 2.570 | 2.570 | 2.566 | |
| Canola | 19.200 | 21.804 | 19.239 | 7.500 | 8.200 | 9.331 | |
| Flaxseed | 0.340 | 0.454 | 0.258 | 0.240 | 0.235 | 0.225 | |
| Soybeans | 7.600 | 6.793 | 7.568 | 5.500 | 5.250 | 5.421 | |
| TOTAL | 89.964 | 98.385 | 90.424 | 49.532 | 50.247 | 52.537 | |
| Domestic Usage | Ending Stocks | ||||||
| 2026/27 | 2025/26 | 2024/25 | 2026/27 | 2025/26 | 2024/25 | ||
| Jan | Jan | ||||||
| All wheat | 8.384 | 8.122 | 7.969 | 5.700 | 7.500 | 4.112 | |
| Durum | 0.773 | 0.786 | 0.737 | 1.100 | 1.500 | 0.496 | |
| Barley | 6.160 | 6.084 | 5.372 | 1.000 | 1.700 | 1.249 | |
| Corn | 14.800 | 14.751 | 14.759 | 1.900 | 1.600 | 1.584 | |
| Oats | 1.080 | 1.046 | 0.972 | 0.750 | 0.830 | 0.507 | |
| Canola | 12.900 | 12.551 | 11.667 | 1.650 | 2.750 | 1.597 | |
| Flaxseed | 0.090 | 0.089 | 0.071 | 0.295 | 0.275 | 0.134 | |
| Soybeans | 2.300 | 2.098 | 2.461 | 0.650 | 0.400 | 0.505 | |
| TOTAL | 46.248 | 45.300 | 43.639 | 12.125 | 15.305 | 9.830 | |
| Pulse and Special Crops | |||||||
| Production | Exports | ||||||
| 2026/27 | 2025/26 | 2024/25 | 2026/27 | 2025/26 | 2024/25 | ||
| Jan | Jan | ||||||
| Dry peas | 2.850 | 3.934 | 2.997 | 2.700 | 2.500 | 2.175 | |
| Lentils | 2.250 | 3.363 | 2.431 | 2.200 | 2.100 | 1.821 | |
| Dry beans | 0.375 | 0.438 | 0.424 | 0.385 | 0.380 | 0.402 | |
| Chickpeas | 0.260 | 0.482 | 0.287 | 0.200 | 0.200 | 0.209 | |
| Mustard | 0.135 | 0.140 | 0.192 | 0.095 | 0.095 | 0.091 | |
| Canaryseed | 0.135 | 0.235 | 0.185 | 0.135 | 0.135 | 0.133 | |
| Sunflower | 0.065 | 0.069 | 0.051 | 0.035 | 0.035 | 0.036 | |
| TOTAL | 6.070 | 8.661 | 6.568 | 5.750 | 5.445 | 4.868 | |
| Domestic Usage | Ending Stocks | ||||||
| 2025/26 | 2025/26 | 2024/25 | 2026/27 | 2025/26 | 2024/25 | ||
| Jan | Jan | ||||||
| Dry peas | 0.680 | 0.678 | 0.671 | 0.755 | 1.265 | 0.489 | |
| Lentils | 0.350 | 0.352 | 0.350 | 1.310 | 1.535 | 0.549 | |
| Dry beans | 0.075 | 0.073 | 0.073 | 0.080 | 0.095 | 0.040 | |
| Chickpeas | 0.090 | 0.089 | 0.088 | 0.305 | 0.295 | 0.062 | |
| Mustard | 0.054 | 0.052 | 0.054 | 0.140 | 0.145 | 0.143 | |
| Canaryseed | 0.015 | 0.014 | 0.012 | 0.155 | 0.170 | 0.084 | |
| Sunflower | 0.065 | 0.065 | 0.065 | 0.135 | 0.145 | 0.151 | |
| TOTAL | 1.329 | 1.323 | 1.314 | 2.880 | 3.650 | 1.518 | |