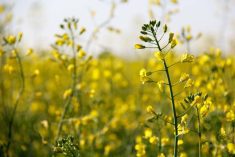
Glacier FarmMedia | MarketsFarm — Agriculture and Agri-Food Canada revised its canola estimates in its July supply and demand report released on July 21.
Most notably, AAFC incorporated the updated 2024/25 canola production figure from Statistics Canada, that’s now just short of 19.19 million tonnes versus its previous call of 17.85 million.
That saw AAFC increase its feed, waste and dockage estimate from minus 959,000 tonnes in its June report to now 204,000 tonnes. As well, the department bumped up its estimate for old crop canola exports to 9.50 million tonnes.
Read Also
Speculators add to bullish bets in canola
The speculative net long position in canola continues to grow, hitting its largest level in eight months according to the latest Commitments of Traders report from the United States Commodity Futures Trading Commission (CFTC) released Friday, March 20.
As for 2025/26 canola, AAFC trimmed production by 200,000 tonnes at 17.80 million tonnes, based on yields slipping to 2.08 tonnes per hectare from last year’s 2.17.
As well, AAFC raised its domestic use by 500,000 tonnes at 1.90 million and dropped ending stocks by 750,000 tonnes from June to now 1.10 million.
July estimates for Canadian major crops supply and demand: in million tonnes. Source: Agriculture and Agri-Food Canada.
| Grains and oilseeds | |||||||
| Production | Exports | ||||||
| 2025/26 | 2025/26 | 2024/25 | 2025/26 | 2025/26 | 2024/25 | ||
| July | June | July | June | ||||
| All wheat | 34.433 | 34.730 | 34.958 | 25.700 | 26.100 | 27.200 | |
| Durum | 5.571 | 5.431 | 5.870 | 4.600 | 4.600 | 5.400 | |
| Barley | 7.900 | 8.080 | 8.144 | 2.740 | 2.840 | 2.840 | |
| Corn | 15.450 | 15.107 | 15.345 | 2.300 | 2.300 | 2.900 | |
| Oats | 3.395 | 3.380 | 3.358 | 2.420 | 2.320 | 2.470 | |
| Canola | 17.800 | 18.000 | 19.185 | 6.000 | 6.000 | 9.500 | |
| Flaxseed | 0.315 | 0.230 | 0.258 | 0.225 | 0.200 | 0.250 | |
| Soybeans | 7.425 | 7.250 | 7.568 | 5.650 | 5.450 | 5.400 | |
| TOTAL | 87.454 | 87.514 | 89.388 | 45.235 | 45.410 | 50.716 | |
| Domestic Usage | Ending Stocks | ||||||
| 2025/26 | 2025/26 | 2024/25 | 2025/26 | 2025/26 | 2024/25 | ||
| July | June | July | June | ||||
| All wheat | 8.558 | 8.605 | 8.463 | 4.300 | 4.250 | 4.000 | |
| Durum | 0.796 | 0.806 | 0.602 | 0.500 | 0.450 | 0.300 | |
| Barley | 5.560 | 5.540 | 5.705 | 0.600 | 0.600 | 0.900 | |
| Corn | 14.950 | 14.807 | 14.741 | 1.900 | 1.700 | 1.600 | |
| Oats | 0.995 | 1.080 | 1.000 | 0.350 | 0.350 | 0.350 | |
| Canola | 11.900 | 11.400 | 11.755 | 1.100 | 1.850 | 1.100 | |
| Flaxseed | 0.090 | 0.090 | 0.092 | 0.100 | 0.040 | 0.090 | |
| Soybeans | 2.250 | 2.250 | 2.465 | 0.530 | 0.555 | 0.555 | |
| TOTAL | 44.770 | 44.220 | 44.621 | 9.060 | 9.545 | 8.705 | |
| Pulse and Special Crops | |||||||
| Production | Exports | ||||||
| 2025/26 | 2025/26 | 2024/25 | 2025/26 | 2025/26 | 2024/25 | ||
| July | June | July | June | ||||
| Dry peas | 3.200 | 3.125 | 2.997 | 2.000 | 1.650 | 2.300 | |
| Lentils | 2.450 | 2.325 | 2.431 | 2.100 | 2.100 | 2.000 | |
| Dry beans | 0.400 | 0.370 | 0.424 | 0.400 | 0.380 | 0.400 | |
| Chickpeas | 0.315 | 0.265 | 0.287 | 0.185 | 0.175 | 0.190 | |
| Mustard | 0.105 | 0.085 | 0.192 | 0.095 | 0.095 | 0.095 | |
| Canaryseed | 0.170 | 0.125 | 0.185 | 0.125 | 0.120 | 0.125 | |
| Sunflower | 0.065 | 0.051 | 0.051 | 0.040 | 0.030 | 0.050 | |
| TOTAL | 6.705 | 6.346 | 6.568 | 4.945 | 4.500 | 5.160 | |
| Domestic Usage | Ending Stocks | ||||||
| 2025/26 | 2025/26 | 2024/25 | 2025/26 | 2025/26 | 2024/25 | ||
| July | June | July | June | ||||
| Dry peas | 0.670 | 0.670 | 0.612 | 0.975 | 1.300 | 0.425 | |
| Lentils | 0.300 | 0.300 | 0.316 | 0.530 | 0.305 | 0.405 | |
| Dry beans | 0.060 | 0.060 | 0.059 | 0.065 | 0.055 | 0.055 | |
| Chickpeas | 0.085 | 0.085 | 0.081 | 0.170 | 0.150 | 0.085 | |
| Mustard | 0.044 | 0.044 | 0.045 | 0.125 | 0.105 | 0.150 | |
| Canaryseed | 0.015 | 0.015 | 0.014 | 0.120 | 0.080 | 0.090 | |
| Sunflower | 0.065 | 0.066 | 0.066 | 0.120 | 0.115 | 0.135 | |
| TOTAL | 1.239 | 1.240 | 1.193 | 2.105 | 2.110 | 1.345 | |