
Based on the amount of seed information available to growers in the past, we get the impression that it was a bit like throwing darts when it came to choosing an ideal seed. Your method of choice may have been to try a variety that your farm neighbour had success with or maybe you just chose whichever was most available that planting season.
Not anymore.
Thanks to data collected from field trials, input from seed organizations and the advent of the internet, now more than ever there’s a wealth of information available for growers.
Read Also
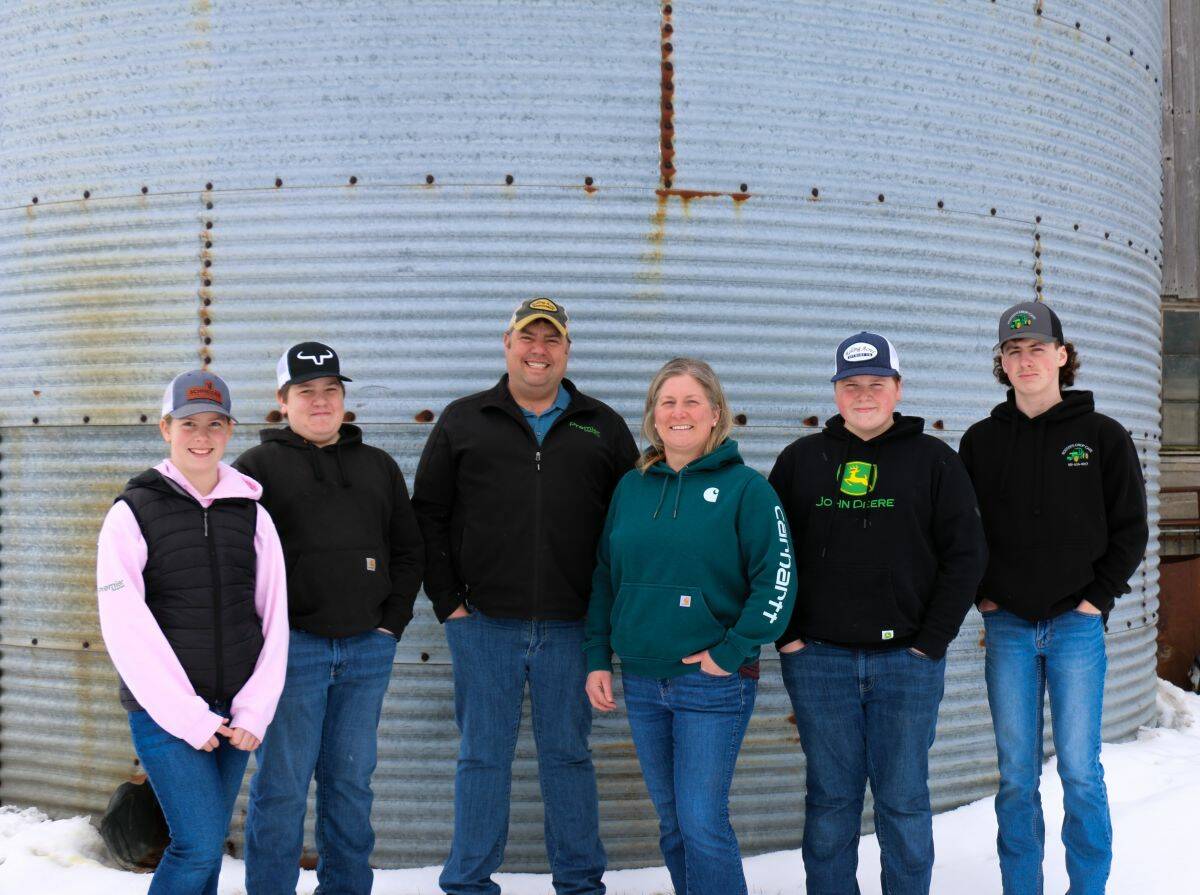
Trust, teamwork and lessons in resilience
When a string of misfortunes hit this Ontario farm, trust, teamwork and quick lessons in resilience got them through.
But with so many seed varieties to choose from it’s essential that you make the best educated choice about which seed to put in the ground to ensure good yields come harvest.
Seed Manitoba makes this sort of decision-making much easier.
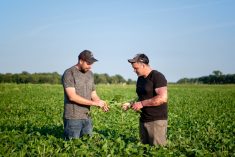
Dennis Lange is the provincial pulse and soybean specialist with Manitoba Agriculture.
He’s been working on putting together the 2025 edition of Seed Manitoba with the team at Country Guide’s sister publication, Manitoba Co-operator.
This seed guide is chock-full of agronomic information about varieties of cereal, pulse, oilseed, forage and specialty crops. So much information can be a bit daunting for growers, so Lange has come up with a method to help them narrow down potential seed choices.
All you need is a highlighter.
I met with Lange late last year so that he could demonstrate his method in person. Below is our conversation, edited lightly for clarity. You can find the full video at the Manitoba Co-operator website.
Get out your highlighters
Lange calls his method “the highlighter test.”
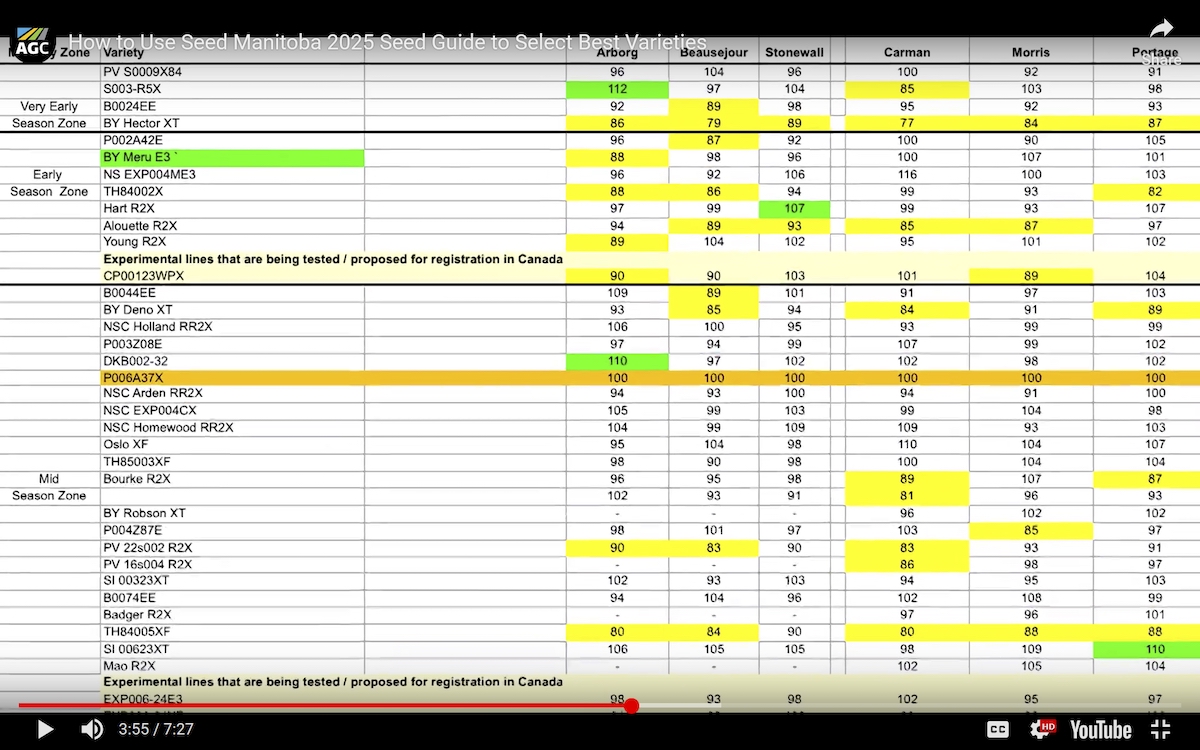
“When used properly, it will give you a good picture of how each crop type will do at different locations,” Lange explains. “It’s to be used with any single site year data. For example, in soybeans, we have sites in Arborg, Beausejour and Stonewall, as well as the core sites at Carman, Portage la Prairie, St. Adolphe and Morris.”
He explains the highlighter method as follows:
“When you look at the bottom of the table, you’ll see in the gray section something called CV, which is the coefficient of variance. That tells you how good the trial is. The lower the number, generally under 10, means it’s a very well-run trial, not a lot of variation, not a lot of other factors contributing to what the yield numbers are showing. It gives the true genetic potential of the varieties that you see.
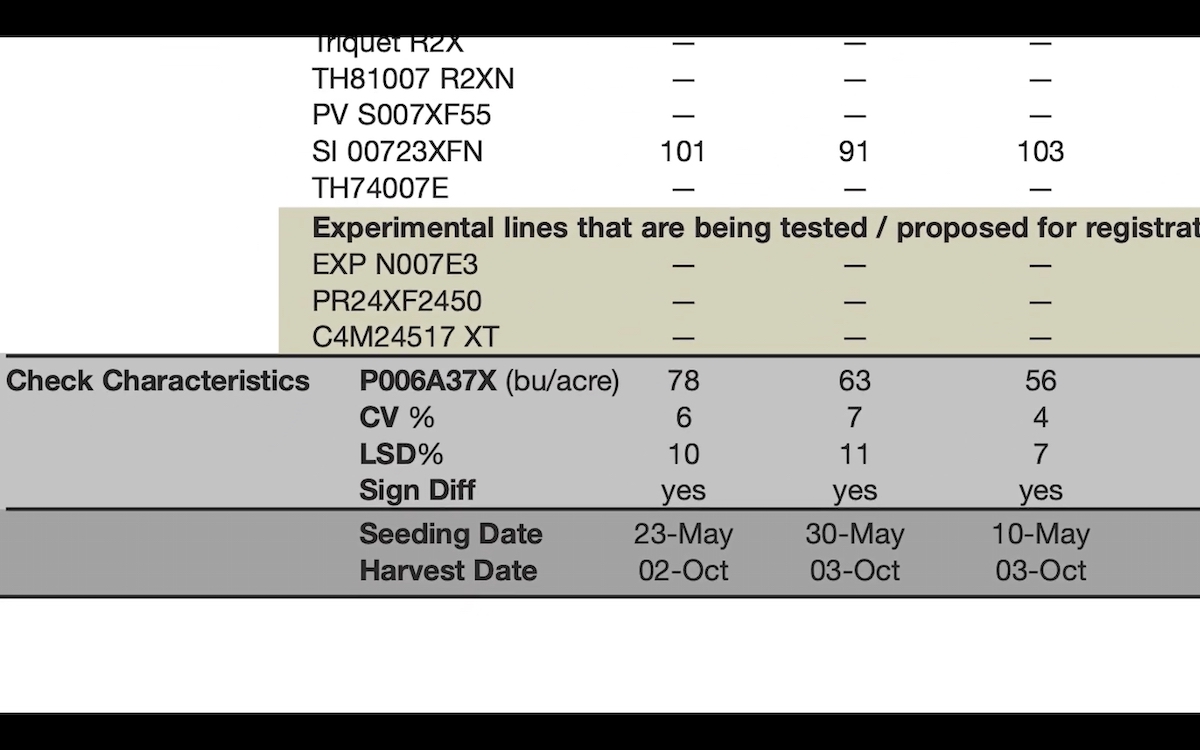
“The number that you’re interested in is called the LSD. That stands for least significant difference. This means that whatever the value is for a given site, any two varieties that you’re comparing within the table have to be different by that amount.
“For example, the Arborg table this year shows 10 per cent. That number is generated from the stats that are run on the individual trial and will be different for each location. So, if you see that 10 per cent, highlight that LSD with your pink highlighter, and then go across the bottom.
“Then take another colour highlighter, let’s say green, and go up the table. Anything that is 10 per cent greater than your check (so in this example our check is P006, a 37x), you highlight in green, then go all the way down that column. So, for the Arborg site, you might see three different varieties that are statistically higher yielding.
Now, grab a yellow highlighter and anything that is 90 per cent less (10 per cent less than the check, so 90 or lower), highlight in yellow. “If you do that for each site, you’ll get a checkerboard pattern of different colours.
“Green are higher yielding than the check. Generally, at each site, you might see maybe two or three varieties outyielding a check. You might see a few more yellow varieties on certain years, because those yellow varieties usually are the earlier season varieties that don’t yield as much as what a mid- or long-season variety does, depending on the growing season. But what’s also important is anything that’s not highlighted is the same yield as the check. So, if your LSD is 10 at Arborg and your yield is 105 per cent that tells us it’s the same yields as the check.
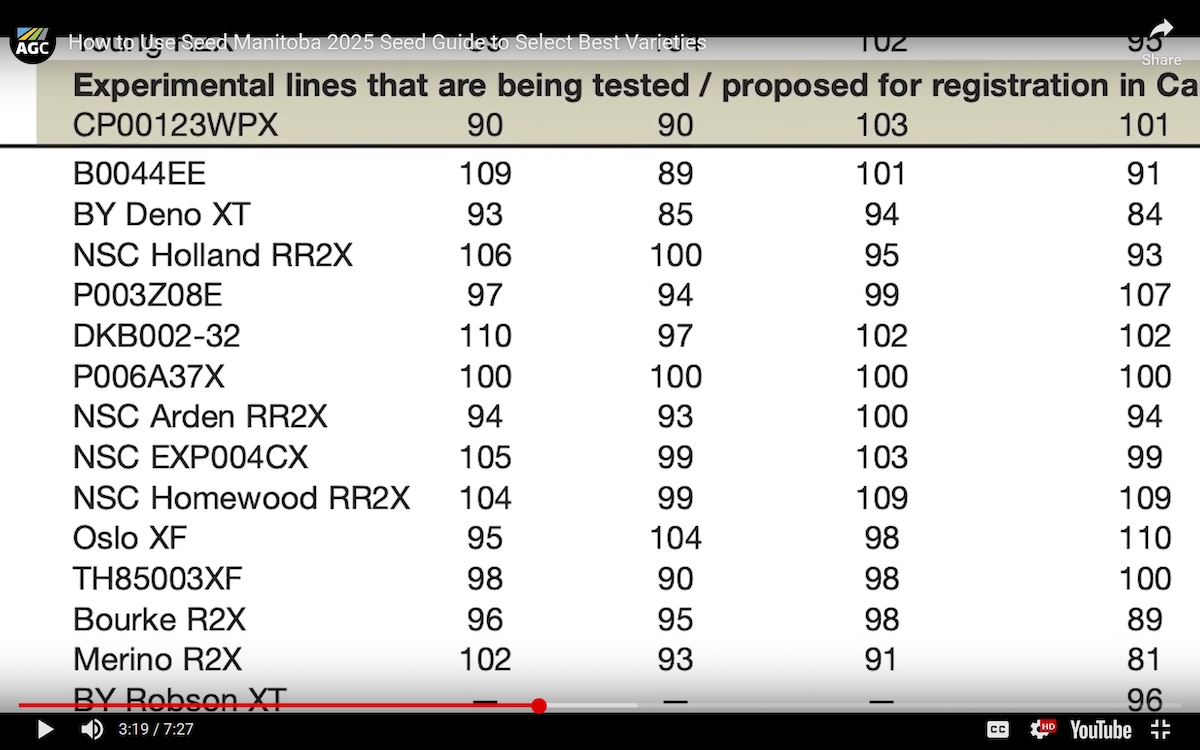
“Because we choose such a strong check, as long as you’re staying within your maturity group, you’re picking a good variety. And because the varieties are listed from earliest maturing at the top (of the list) to longest maturing at the bottom, if you see a variety that maybe doesn’t have any green or yellow in it (but nothing is highlighted), that means the variety is the same yield as a check. But because it’s earlier, it’ll gain you a few more days’ advantage as far as harvestability goes, because the crop matures earlier.
“You can use this same process for any table with an LSD in it. Highlight the LSD first, then highlight the check so you know what you’re comparing it to. And when you go through this process, eventually it will help you pick a variety.
“Some growers say to me, ‘I only want to look at the site that’s closest to me.’ But if you only look at one site, you only know what the weather was like at that one site for the past year. You don’t know what the forecast is going to be for next year. If you look at all the sites, that will give you a good idea on how a variety performs under different weather patterns, different amounts of moisture, different planting dates and all those factors that play into it.
“Once you’ve picked your variety, go back to the main part of the table, the variety description table, and look at the long-term yield which will have a number of site years, which is basically the number of different locations that have been tested. If a variety has been tested for 21 site years (and) there are seven site years per season, it’s been tested over three growing seasons. The higher the site years, the better, because you can be confident in the yield results.
“It’s a bit of a process but get yourself a few highlighters and walk through (the exercise). In the end it’s a quick way of showing the differences between varieties or (whether there) are no differences between varieties.
“I’ve done this at different meetings with growers (and it’s) kind of fun to do because it gives you a really good impression of how a trial performs. It also helps eliminate some of the ‘sales pitch’ stuff, because the information that’s being calculated is a true representation of the genetic potential of those varieties. It’s verified data.
“Every year it’s a process (to put the guide together),” Lange sums up. “It takes a lot of information, and a lot of time goes into it. But at the end of the day, to have the finished product for growers and the industry, it’s well worth it.”
You can find the guide at www.seedmb.ca/digital-edition/seed-manitoba_2024-12-19/.
Our thanks to Manitoba Agriculture staff and Seed Manitoba for their contributions to this article.