
What if we could peer into the future and catch a glimpse of where our agriculture is heading? How would such a view shape the development of plant breeding and advances in technology, and maybe even the impact on farmers?
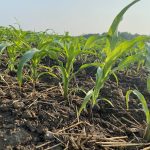
A University of Guelph PhD student is working to develop a new yield model, first for corn production but with an eye to also using it for soybeans, wheat and forages (the four largest crops by area in Ontario).
Qin Xu is working on the model with help from Dr. Glenn Fox, who co-authored a similar study in the 1990s with Dr. Brad Rickard, to determine whether grain yields in the province had reached a plateau.
The answer then was “No.” And more than 20 years later in year two of a three-year study using historical data at the county level dating back to 1950, Xu is finding the same answer.
“One of the purposes of the model is to do simulations of the effects of possible future changes in temperature and precipitation levels and timing,” explains Fox, who’s a professor of agricultural and natural resource economics in the department of food, agricultural and resource economics.

The research is actually a sort of revisiting of work into the longevity of advances in innovation. Fox remembers such debates as a student in the 1970s, and then it returning in 1990s when there were real questions about whether the pace of technological change could be sustained.
“It’s sort of an ‘evergreen’ question: is technology slowing down in agriculture?” says Fox. “There are implications for a lot of things — global food security, farmers’ well-being, economic and social development — and it would appear, based on visiting these data at different points, that agricultural technology continues to advance in Ontario and Canada. Does that mean it’s going to go on forever? No, but each time we check in, it seems to be continuing to advance.”
Read Also
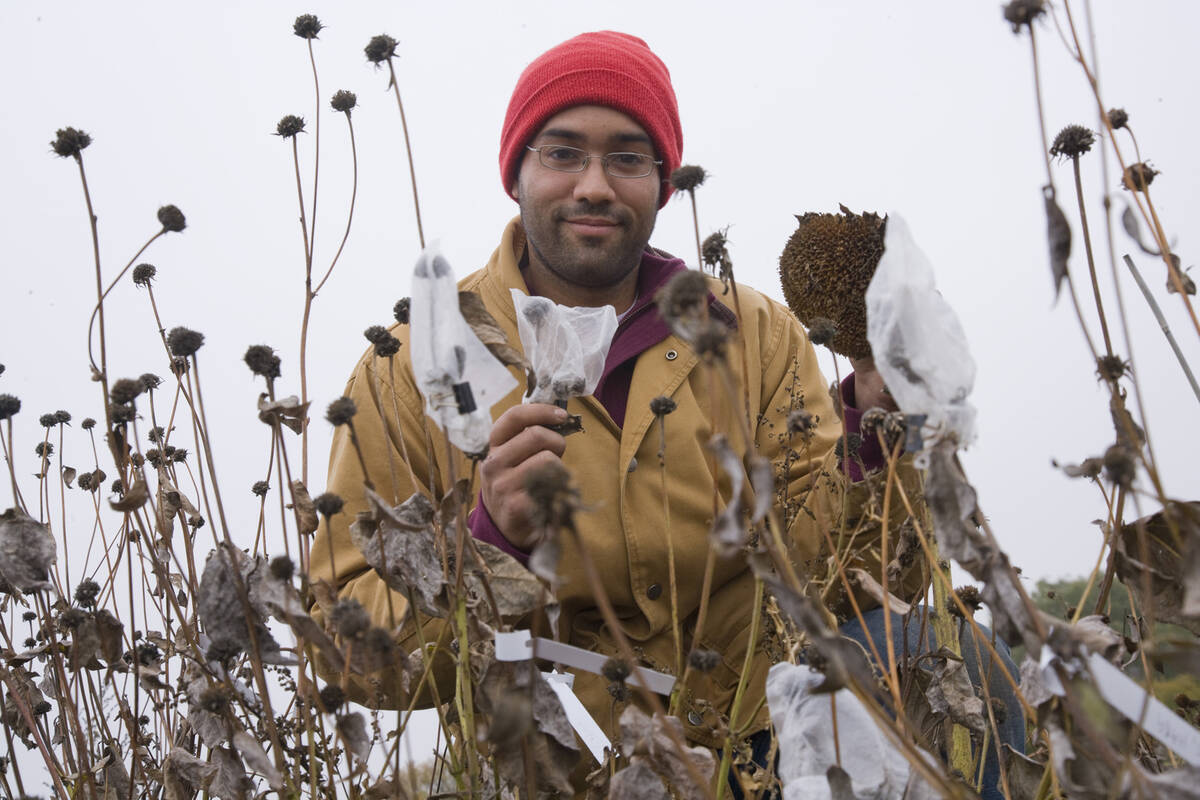
How scientists are using DNA and climate data to breed crops of the future
A method for forecasting how crops will perform in different environments so that plant breeders can quickly select the best parents for new, climate-resilient varieties.
The current model is based on an econometric model. Using data gathered across 29 counties from 1950 to 2013, the model will simulate the future effects of climate conditions and other factors of crop production, but it will estimate long-term effects that will span 50 years — from 2020 to 2070.
In order to make that model as realistic as possible, Xu started out by estimating four crop yield functions — for corn, soybeans, wheat and hay.
“Actually, one of the goals of my study is to consider what agricultural water use policies might be needed under different climate change scenarios,” says Xu, whose husband is also a PhD candidate, working on herbicide management in edible beans. “So in the later stage of my thesis, I may come up with several possible policies in agriculture and examine which policy could bring better water-use efficiency in all of agriculture, and then to compare it to crop insurance.”
There are some unique and innovative developments taking shape in this study. One is the use of a new climate interpolation computer model developed by Natural Resources Canada (NRCan). In order to make this crop yield model as comprehensive as possible, it’s important to have a thorough dataset from as many locations across Ontario as possible. The challenge there is that when you look back to 1950, there weren’t many weather stations from which to garner temperature and precipitation data. Here’s where the computer model from NRCan comes in handy.
“It interpolates for locations that don’t have a weather station nearby,” says Fox. “They’ll use multiple weather stations to interpolate and basically create a synthetic observation point, based on elevation and distance and other characteristics. To our knowledge, no one has used these data to look at crop yields in the way Qin is doing.”
Thus far, Xu’s work has yielded some surprising results, including the optimal definition of “growing season,” which identifies it not by calendar date, but by temperatures. Among four different temperature ranges, the optimal definition occurs when a growing season starts and ends at -2.2 C, generally around the end of April and lasting to the middle of October.
“I’m trying to screen which one could better explain the actual yields we have now and is quite consistent with the growing season we have for corn,” says Xu. “Is that at the end of April or at the beginning of May, and to October in the fall? We have found the first day after the last occurrence of -2.2 C in the spring and ends on the preceding day of the first occurrence of -2.2 C in the fall.”
“We actually haven’t attempted to model any change in climate between 1950 and 2013,” adds Fox. “We’re basically treating that as the reference period and treating it as a period of homogeneous climate, recognizing that that’s probably not true, but we’re not measuring any sort of trends of changes. What we’re planning to do is to take the coefficients that were estimated in the model and then take several of the climate change projections and run those through the model to see what effect that would have on yields over the simulation period, from 2020 to 2070.”
What this project isn’t addressing are the agronomic factors that have become standards in corn production, such as planting density or seed depth. At its core, the research is trying to determine models for climate-related practices, including irrigation, and how those relate to increasing corn yields. In the U.S., similar research has been used in models with updated data for calculating crop insurance premiums.
Xu and Fox aren’t measuring the effects of any one particular technology. There is a time trend in the model which picks up the net and cumulative effect of all technologies that have been implemented in past decades. But those could include biological, chemical or mechanical technologies that have come to the fore from 1951 to 2013. And there have been some significant changes in corn production, including planting densities, genetic improvements of hybrids (and other crops, as well). But it’s the combined effect of all of those that Fox and Xu believe is captured in the time-trend variable.
One of the other hoped-for features of the simulation models that Xu is building is that it will give farmers the option to use irrigation in these future scenarios during abnormally dry periods. Part of her research has determined that corn yields would be higher with greater levels of both precipitation and solar energy during the growing season. On the other hand, higher precipitation levels before the growing season tend to cause a reduction in yields.
Fox notes there isn’t much irrigation that goes on in Ontario field crop production now compared to what takes place in the U.S. But some observers have suggested that in the future in Ontario, farmers might want to use irrigation more. So the models being developed by Xu could determine the extent to which irrigation practices give rise to water-use conflicts.
“The challenge with innovation is that it’s inherently unpredictable — because you’re imagining something that doesn’t exist,” says Fox. “So at any point in time, it’s really sort of a glass-half-empty-glass-half-full scenario, but if you look at the half-empty part, we don’t know what the next innovation is going to be, and what happens if it isn’t — what happens if there is no next innovation?”
For now, that’s not a concern.
This article was originally published in the January 2017 issue of the Corn Guide.