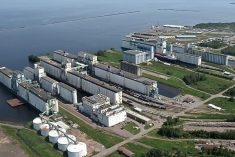
CNS Canada — The lineup of grain vessels waiting for loading at Vancouver increased to 21 for Week 8 of the grain shipping season.
Reports by Quorum Corp., which monitors Prairie grain handling, stated vessels at Vancouver were up 31 per cent from the previous week (17). The increase in ships raised sentiments that grain orders and exports may soon pick up.
At Prince Rupert, three vessels were waiting.
Total West Coast port unloads were 14 per cent higher than the four-week rolling average, but three per cent lower than last week.
Read Also

U.S. grains: Wheat futures rise on supply snags in top-exporter Russia
U.S. wheat futures closed higher on Thursday on concerns over the limited availability of supplies for export in Russia, analysts said.
As of Week 7, grain shipments leaving from the port of Vancouver were 11 per cent below last year at 2.324 million tonnes, down from 2.612 million, and 10 per cent below the five-year average of 2.577 million.
Prince Rupert was picking up some of the slack, operating at 38 per cent ahead of last year (664,900 tonnes, up from 482,000) and 11 per cent ahead of the five-year average (600,700 tonnes).
Overall, shipments through West Coast ports were three per cent less than a year ago and six per cent below the five-year average.
Thunder Bay shipments are down two per cent compared to last year and 25 per cent below the five-year average.
Meanwhile, country stocks in store (excluding stocks stored at export terminals) were below last year’s level at this time (3.727 million tonnes, down from 3.941 million tonnes) but ahead of the five-year average of 3.251 million tonnes. That’s based on Quorum’s Week 7 reports, ending Sept. 25.
Table: Country stocks in store, in thousands of tonnes, Week 7.
| Manitoba. . | Saskatchewan. . | Alberta. . | B.C. . | Total | |
| 2018-19 | 814.4 | 2,064.7 | 834.0 | 13.8 | 3,726.9 |
| 2017-18 | 839.0 | 2,046.7 | 1,029.5 | 26.4 | 3,941.6 |
| 5-year average. . | 681.4 | 1,670.3 | 874.5 | 25.0 | 3,251.2 |