When the Dowling farm at MacDowall, Sask., runs any of its three New Holland combines of various vintages, canola losses out the back are basically the same. The three models are a TR96 from 1991, a TR99 from 2000 and a CR970 from 2004. “I was impressed with how consistent they were,” says Sheldon Dowling. “The old one was right in there with the new one.”
Any personal bias Dowling had for one combine over another can be ruled out because his comment is based on results from a 2019 canola combine loss survey by Prairie Agricultural Machinery Institute (PAMI). Surveyed losses across all three Dowling machines were 0.8 bu./ac. — which, for them, was a satisfying result. “We were hoping for anything under one bu./ac.,” Dowling says.
Read Also
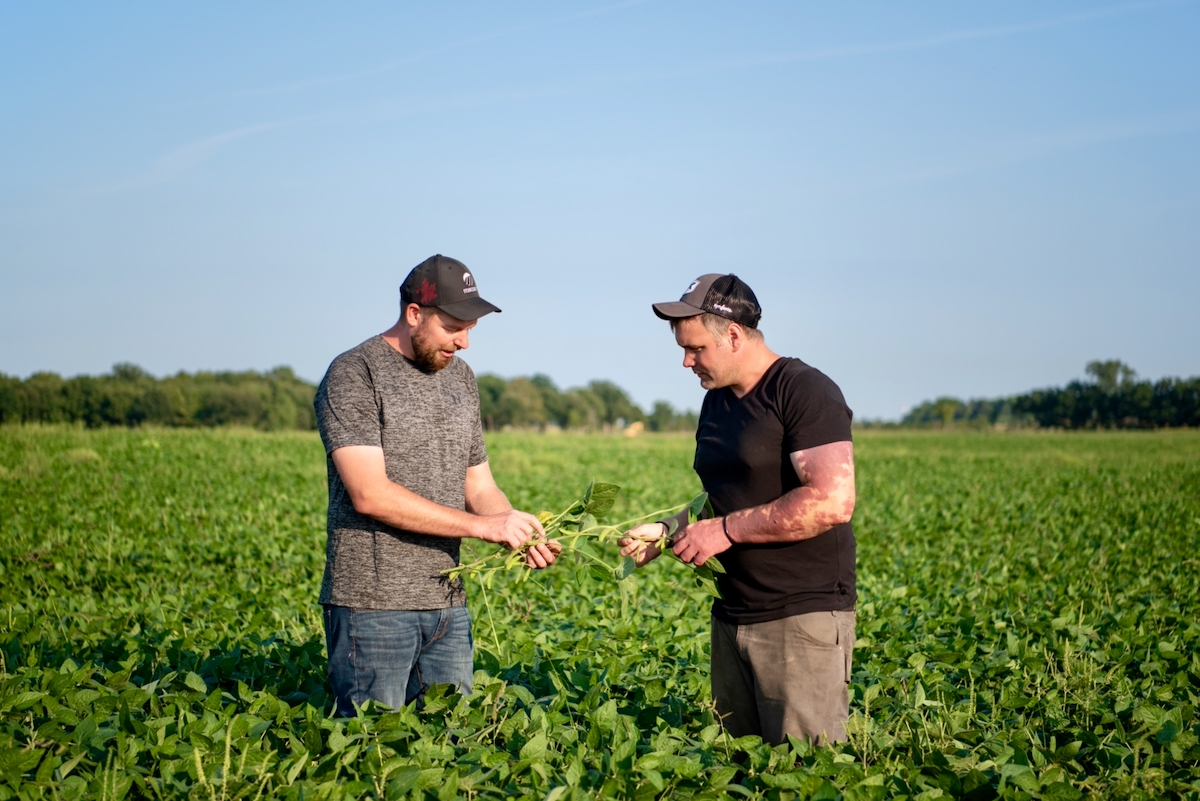
Ontario farmers partner for success
Ontario business partners, Matt Bergman and DJ Wassenaar, have been farming together for 10 years. Their focus on integrating unconventional…
The Dowlings agreed to participate in the survey after PAMI put out a Twitter call for volunteers. They often checked for combine losses and were pretty sure the machines were okay, but they were looking for some outside confirmation. “We wanted to make sure we were doing it right,” Dowling says.
Combine losses of around one bu./ac. (or two per cent) of yield are a good target for canola, says Shawn Senko, agronomy specialist with the Canola Council of Canada. “We know that losses can be five bu./ac., and sometimes more, in tough harvest conditions and when the combine is pushed beyond its limits,” Senko says. “A target loss of one bu./ac. strikes a good balance between harvest productivity and capturing as much of the crop as possible.”
Survey of 40 models
Between August 22 and October 18, 2019, PAMI visited 31 farms across Alberta, Saskatchewan and Manitoba, and measured canola combine losses from 50 machines. These included 40 models from six manufacturers.
Each loss test was repeated three times per combine, and operators were asked to run at their normal settings and ground speed. “If you don’t operate business as usual, it’s a pointless exercise,” says Amie Harrison, PAMI’s project lead. (See further down for details on how to test for losses.)
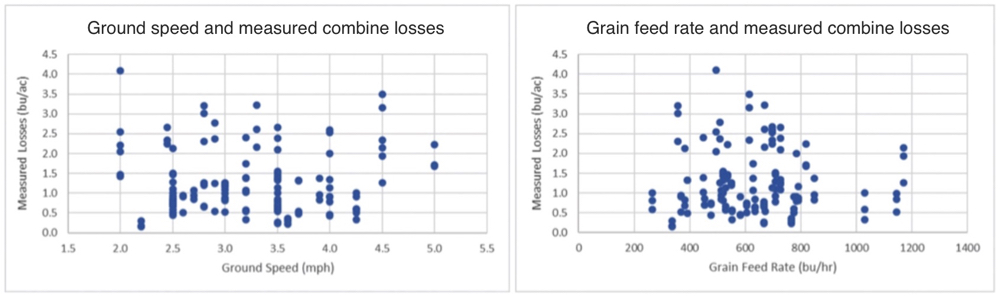
The range of loss for the survey was 0.2 to 4.1 bu./ac. (0.4 to 10.7 per cent of yield), with an average of 1.3 bu./ac. (2.8 per cent). Surveyors also gathered information on weather conditions, harvest practices, canola variety, ground speed, grain feed rate and combine age. (See Table 1 below)
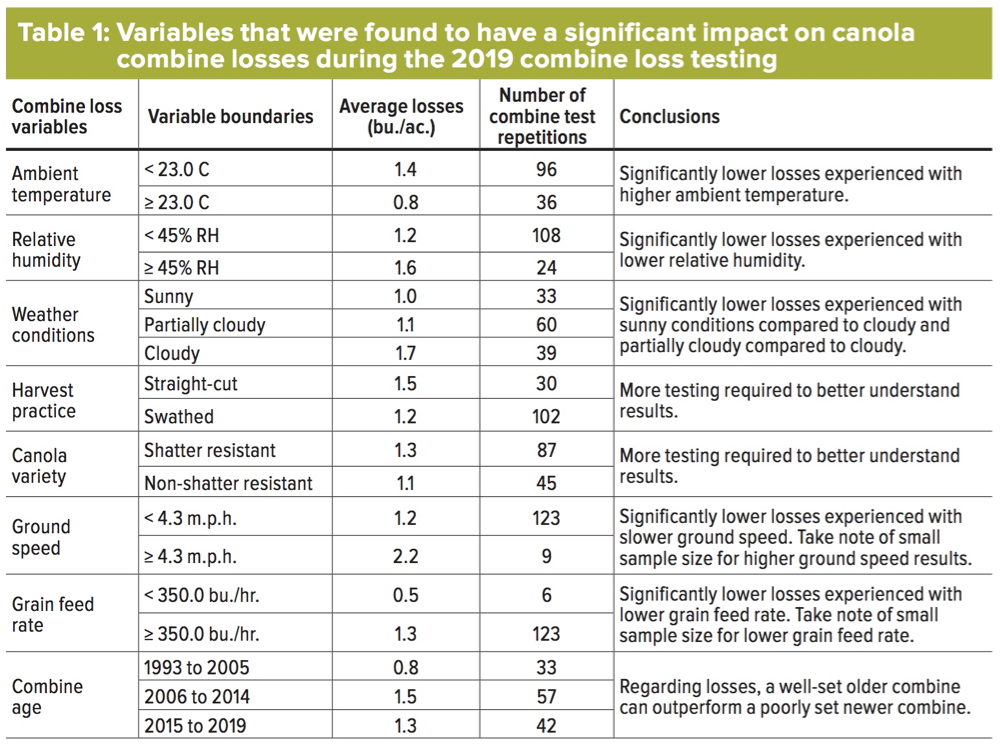
Harrison says the results show that combine brand, model and age are not major factors. What makes the difference is how well the operator knows the machine, and how the operator adjusts to environmental conditions.
“Combine setup and operation greatly impacted losses,” Harrison says. “This project highlighted how important it is for producers to understand machine setup and operation, and how operating with a good setup can compensate for some of the challenging variables present during harvest.”
She expects that familiarity with the machines might be a big reason why older combines performed just as well as new machines, even though the newer machines have more capacity and in-cab controls that allow for easier adjustment of sieves, for example.
“Measuring losses is a great way to verify combine setup and operation,” she adds.
Back to the Dowling farm
On survey day at the Dowling farm, PAMI arrived around 10 a.m. to where they were combining Nexera canola. “There was no dew that morning, the canola was dry and it was a decent harvest day,” Dowling says.
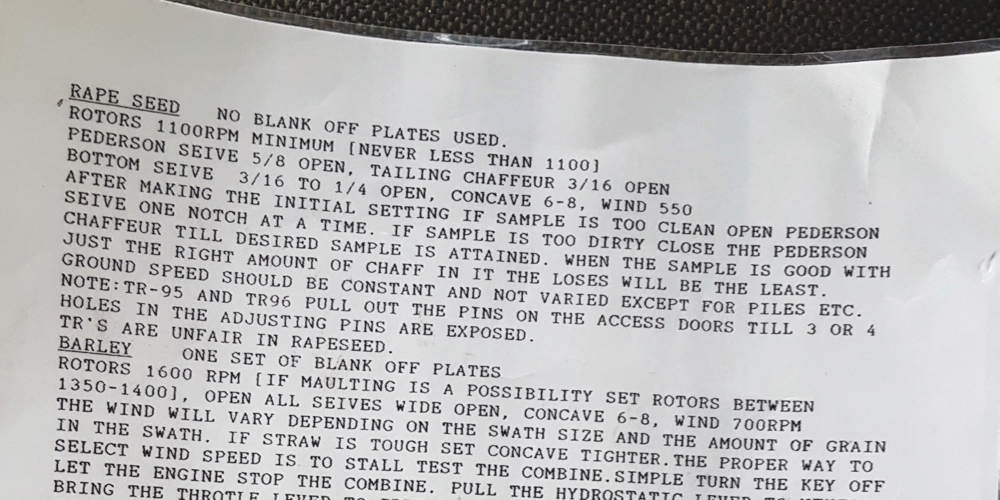
As instructed, they did everything “business as usual.” They always start with the base settings from a “cheat sheet done up by the guy who does most of our combine maintenance,” Dowling says. The cheat sheet for canola reads like this: Rotors 1,100 RPM minimum. Peterson sieve 5/8 open. Tailing chaffer 3/16 open. Bottom sieve 3/16 to 1/4 open. Concave 6-8. Wind 550.
“I pull out this sheet for reference every fall,” Dowling says.
From there, the Dowlings look at the sample coming into the combine grain tank and make adjustments to make sure the sample meets their expectations: Just a little bit of dockage. Not too clean.
They don’t bother checking for losses out the back of the combine until the sample is up to standard. “There’s no sense checking for losses until I’m happy with the sample in the tank because I’m not going to leave the settings there,” Dowling says. Once the dockage level looks about right, they’ll check the loss situation and tweak settings if necessary.
Senko says this background knowledge is really important for any analysis of combine loss. “You have to know what to do with your results,” he says. Familiarity with the machine helps. “When you know which adjustments make a difference, and you know how to make those changes, you are better able to respond to the results from a harvest loss measurement.”
The Dowlings were definitely familiar with their TRs after a couple of decades, and were becoming more familiar with their new-to-them CR 970. Even so, they were keen to have PAMI do the survey so they could get third-party verification of their process.
“In the end, the survey gave me the confidence to trust that we were doing things right,” Dowling says.
How to check for combine losses
The ideal is to check for losses each time a machine starts on a new field and as conditions change. Over time, operators will become more familiar with how a combine responds to field conditions and how to tweak the settings without having to check as often.
Here are the steps to make a proper loss assessment:
Step 1. Choose your drop pan. You can use anything from a plastic bucket on a stick, to a garbage can lid you toss under the combine, to a full-width pan attached to the combine underbelly and released with a switch. Calculate the square feet of the chosen pan.
The ideal pan is one that closely matches the combine’s discharge width. This will limit sampling error as the amount of seed coming out the back can range quite a bit between the centre and the sides of the shoe.
For the survey, PAMI used full-width pans from Schergain and Bushel Plus. They are as wide as the combine-discharge area and attach to the underside of the combine using an electron magnet. They drop on command with the flick of a switch. Sheldon Dowling was so impressed with these pans that he put one on his Father’s Day wish list.
Step 2. Disengage the chaff spreader and straw chopper. With these tools disengaged and out of the way, all straw and chaff drop straight down into the pan. This provides a more accurate measurement. (In the PAMI survey, six combines did not disengage the spreader and chopper. PAMI did not include those results in the final report “due to the reduced accuracy experienced when spreading straw.”)
Step 3: Use the pan to gather a sample. With the combine fully engaged in the crop and going at normal speed, drop the pan.
Step 4: Clean the sample. Once the combine has passed over the pan, take all contents from the pan and carefully separate the seeds from the chaff and straw. Grading screens, like those used at the elevator, can work well.
Step 5: Measure the seed. How much canola (by weight or volume) did you capture per square foot? With that measurement, use tables from the PAMI Combine Seed Loss Guide to calculate the loss per acre.
Shawn Senko likes the volume measurement because it doesn’t require a scale. PAMI measured weight for their survey. Results should be similar unless there’s a lot of dockage in the sample, which may influence the volume option more than the weight option.
With losses measured, you can make further adjustments and keep testing until losses are in line with their goals.
Calibrate loss monitors. Use these loss measurements to help calibrate the combine loss monitors. At the moment the pan is released, make note of the loss monitor reading. Do this each time and keep a log. With repeated loss measurement, farmers will start to figure out what the loss monitors are really telling them.
Jay Whetter is communications manager with the Canola Council of Canada.