
For much of the past decade, provincial extension personnel, certified crop advisors (CCAs) and retailers have talked about declining soil organic matter levels in soils across Ontario. The trends towards intensive farming, shorter rotations, a decline in livestock farming and general practices that focus more on yield are some of the factors cited, together with the reality that it takes decades to raise organic matter levels by a fraction of a percentage point.
Now, there’s evidence of the extent to which this trend has been developing. In late 2016, Christine Brown, field crops sustainability specialist for the Ontario Ministry of Agriculture, Food and Rural Affairs (OMAFRA) was talking to Jack Legg from SGS Agri-Food Laboratories in Guelph. The discussion centred on changes in soil-test phosphorus and soil-test potash, comparing those values over the years, and how useful those values are to have. At that point, Legg said, “You know I have those for soil organic matter, too.”
Read Also
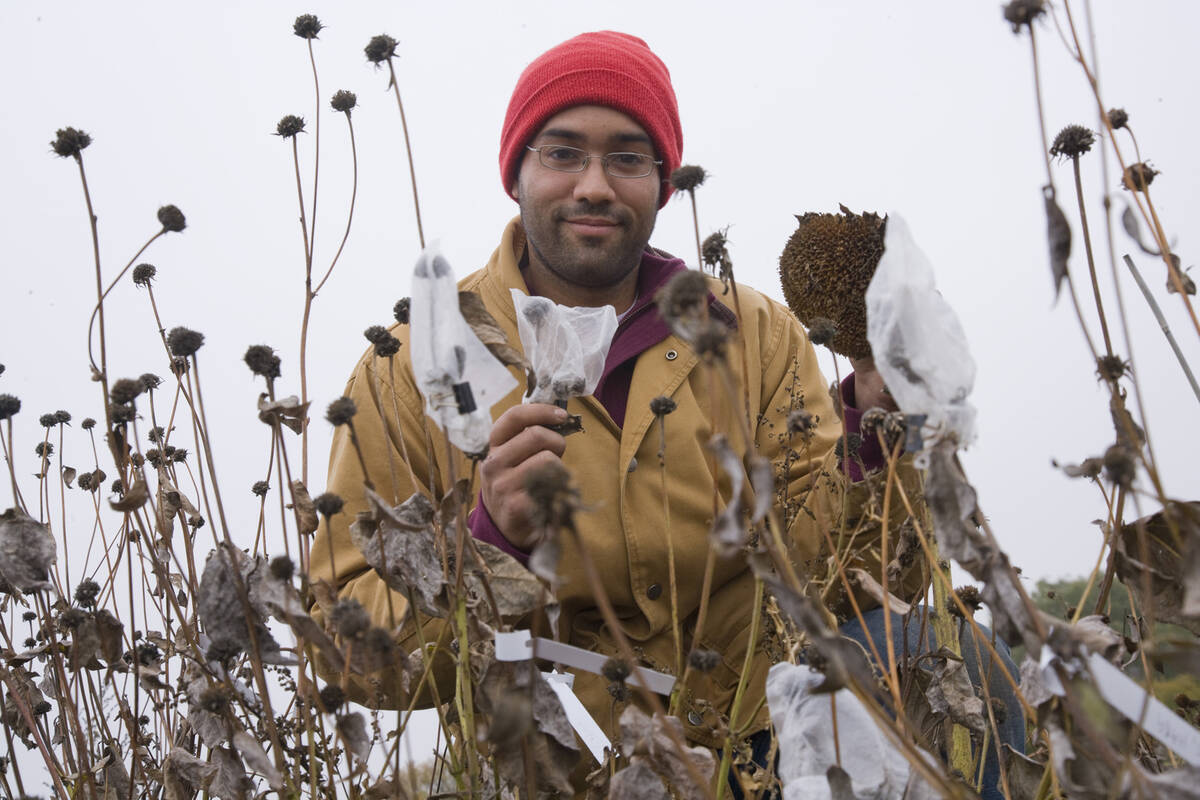
How scientists are using DNA and climate data to breed crops of the future
A method for forecasting how crops will perform in different environments so that plant breeders can quickly select the best parents for new, climate-resilient varieties.
It turned out to be one of the best surprises Brown has ever received.
In all, Legg sent her 15 years of data, with ranges from 12,300 to 23,100 samples per year gathered on a county level, across almost all of Ontario. The same methodology was used for all samples with some of the more obvious factors taken into account — e.g. clay soils are higher in soil organic matter than sandy soils and livestock farms are higher than cash crop farms. From there, Brown compiled the datasets to show the changes over time on a county-by-county basis.
There are some important provisos that must be understood from the outset, says Legg, branch manager and agronomist with SGS Agri-Food Laboratories. Overall the data seem to verify the expected trend, i.e. that soil organic matter (SOM or OM) is declining. However, some of the results could be skewed. For instance, in a year when the Muck Research Station submits large sample volumes, this would bias data higher. The same could occur in years when nutrient management regulations required that large volumes of land that receive manure had to be tested.
Data were also affected where a consultant might cover three counties, yet all samples would be attributed to his or her home county. It’s also possible that some fields included in the data were sampled repeatedly, yet there’s no way to determine whether the same fields were systematically re-sampled over time to accurately assess the trend.
In spite of those caveats, the numbers pulled from that amount of datasets appear to back up the presence of an overall trend. Almost all of the counties showed a decline in OM, although Perth County was maintaining its soil organic matter levels due to widespread manure usage, and counties in the Tobacco Belt (Norfolk and east Elgin) were increasing, which was attributed to reduced tobacco production and more crops that produce residue.
“The data are a revelation. They portray what we know has been happening, and put some numbers to it,” says Brown, who is quick to credit Legg for sharing such a wealth of information. “The nice thing is, it’s not the same farm, it’s those thousands of samples per county and that changes over time, too. But it also provides an indication of just what those changes are and what the trend is.”
Brown made several presentations during the 2017 growing season, including one at the International Plowing Match last September. To demonstrate changes that predate the 15-year mark, she took the older soil surveys from some of the counties and provided a comparison of soil organic matter levels, some dating back more than 40 years. She also incorporated information from Dale Cowan, senior agronomist with Agris Co-op, comparing different crops and the residues produced and retained, as well as losses and gains in one year (see Table 1 below).

“They have information on what the soil organic matter levels were when those books were being produced,” says Brown. “For example, in Essex County, the soil report in 1949 said that 70 per cent of the farms had greater than six per cent organic matter, and the average during the past 15 years is 3.5 per cent. It just gives an indication on a per county basis of how much those changes are — and not every county tells the same story.”
Essex and Kent had the greatest drops in organic matter with Lambton also showing significant losses, mainly due to frequent soybeans and less livestock farming.
Brown acknowledges that soybean is major crop in Ontario and that it’s not an indictment of farmers for growing it. But it does show that it’s a “taker” in terms of fertilizers and inputs and leaves very little residue to replenish soil organic matter.
“If we want to make a difference, we have to emphasize that rotations with multiple years of soybeans aren’t enough, that if you’re going to put in soybeans, there have to be more cover crops or more organic amendments,” says Brown. “Getting that message across is going to be difficult, but at least we have the numbers and the soil organic matter data to show this is actually happening.”
Legg also emphasizes the importance of benchmarking, but cautions against reading too much into the datasets and making any hasty assumptions. It’s a starting point, maybe even a guideline, but not a conclusion.
“I want to be careful with the data, from the standpoint that we are in no way accusing farmers of blatantly depleting their organic matter,” adds Legg. “I don’t think farmers are ignoring or are apathetic to organic matter, I think it’s so slow to change OM up or down that it just doesn’t enter into the plan, and farming has to be profitable. I’d rather the data be perceived as the impetus to start monitoring and making change.”
Brown agrees, stating that incremental drops in organic matter year-over-year can easily be attributed to soil variability in a field. It can take decades before soil organic matter levels can be documented as decreasing by a full percentage point.
“You can be down one per cent and it’s gone unnoticed because you’ve done that over a couple of generations of farming,” says Brown. “The decrease is slow, but so is building it back.”
SOM — by the numbers
Part of the challenge in understanding why it takes so long to rebuild SOM is all of the math involved. Legg notes that organic matter percentage (OM%) is measured as a per cent value by weight. With one acre to a six-inch depth weighing two million pounds, each one per cent SOM means 20,000 pounds of organic matter. To add that much using manure, it would take roughly 40,000 pounds per acre (considering moisture content with the remainder not being all organic matter). Such numbers aren’t practical and could cause other issues — for instance, if phosphorus is over-applied.
Legg is also cautious with certain assumptions, namely that part of the problem has come from a reliance on synthetic fertilizers as nutrient sources have declined.

“Nutrient is nutrient, no matter the source, and fertilizer is an efficient way to replace plant nutrients, whether it’s a bag of fertilizer versus a truckload of compost or manure,” says Legg. “That said, we should be applying more organic materials, but the cost and carbon footprint of driving it around and applying are restrictive.”
That’s a valid point in the short term. In a longer-term outlook, there are businesses involved in bio-materials and organic amendments that are trying to increase the number of outlets and availability to growers.
That will take time; yet according to those involved in that sector, farm demand is growing. However the density of some of the amendments is problematic: it takes a lot of biomass to produce more than an incremental increase.
The short-term answer — and one that is easy to incorporate at the farm level — is cover crops, and that’s the good news that’s flourished in the past two or three years. Legg maintains that soils should be covered all of the time, and that biological life is active longer when plants are growing, which improves the soil.
“The benefits are multiple, even though cover-cropping does offer management challenges,” Legg says. “Species selection, burndown, residue management, seed emergence when planted into cover — they’re all there. But the more amendments the better: green manure from multi-species covers, poultry manure, cattle, compost. Again, the cost of delivering and applying is higher than the immediate return.”
The ABCs of SOM
It’s important to understand that a fertile soil is not necessarily productive, so more nutrient isn’t the answer. All of the physical characteristics of soil and the non-nutritive factors that inherently improve yield are related to organic matter. Organic matter is defined under three categories: the Living (all macro- and micro-organisms), the Dead (recent additions such as plant residue and manure, which are decomposing and contributing to nutrient cycling) and the Very Dead (ancient organic matter that’s hundreds or thousands of years old).
Organic matter improves soil structure, nutrient cycling, nitrogen and sulphur mineralization, water infiltration, aeration (because roots need air), drainage, water-holding capacity (one per cent OM holds an inch of rainwater) and biological activity. High organic matter soils are also more resistant to compaction and recover better after a compaction event.