
It seems nothing ever happens fast enough in our society, not with Internet connections or email replies, and not with the adoption of technology on the farm. At least, that’s the complaint from the manufacturers and service providers who say farmers just aren’t buying into precision farming fast enough.
Of course, from many farmers’ points of view, the issue looks entirely different. Why should they adopt a technology when it’s still so time-consuming and costly?
When GPS-based yield monitors arrived in the early to mid-1990s, they were an easy sell to growers. Not only was the technology supposed to track yields and print out detailed maps, it was also supposed to help by defining specific acres in a field that would benefit from specific management.
Read Also
Agronomists share tips for evaluating new crop products and tech: Pt. 3
With new products, new production practices and new technology converging on the agriculture industry at a frenetic pace in recent…
At that point, “variable rate” became a buzzword, with assurances that it was coming, and that growers needed to be ready for its arrival, and the talk turned to variable rate spraying, liming, fertilizing, planting — even manure applications.
Unfortunately, the technology couldn’t develop as fast as the concepts or the expectations.
As the 2000s became the 2010s, conditions changed for farmers as well. Costs for land and machinery increased, commodity prices became more volatile and farmers had to cope with an increasingly intrusive consumer sector bolstered by government interventions in farming practices.
Add to this whole scenario the generational shift on our farms and the changing genetics of our major crops, and it’s clear why this variable rate situation can get more complicated, not less.
That’s the setting against which a group from Niagara College is trying to introduce a new computer-based system to enable farmers to input their own data, including any maps they’ve generated and other information pertaining to their farms, to create a variable rate “tool set.”
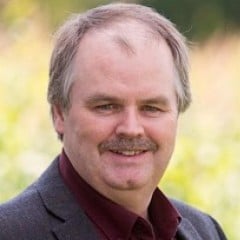
Dr. Michael Duncan and Sarah Lepp are part of that team, working with Ian McDonald, Nicole Rabe and Ben Rosser from the Ontario Ministry of Agriculture, Food and Rural Affairs (OMAFRA). The Precision Agriculture Advancement for Ontario (PAAO) project is a three-year initiative, with funding from the Grain Farmers of Ontario. Duncan is a professor at Niagara College as well as the industrial research chair for the Natural Sciences and Engineering Research Council (NSERC), and Lepp is the senior research associate with Niagara College.
The two have been working on the program’s “crop portal” in an effort to empower growers to do much of the work of analyzing their farming practices themselves. The work is slow for a number of reasons, not the least of which is a reluctance on the part of many farmers to plug their farms into a new computer-based management tool that has so many working parts.
It’s one thing to own a yield monitor and have those numbers available, but it’s another to pull together those data points with other properties of the farm, “clean” that data, and then generate the analysis.
Even then, the grower still has to evaluate the date and decide whether it makes sense to invest the money necessary to put the resulting plans to work, which may require yet more computer programs and more new machinery.
In the end, maybe it’s easier to just stick with the status quo, or maybe shell out a bit more for a certified crop adviser (CCA).
Or is it?
By the numbers
There’s an important question when considering the use of computers on the farm: What are people using them for?
According to the 2011 Agricultural Census, the percentage of farmers using computers for “farm business” was 59.6 per cent (122,697 farms out of 205,730 reporting). In 2006, Statistics Canada reported 106,409 farms using a computer for farm business. The challenge here is one of quantity versus quality. Is a computer used for accounting? For tracking weather? For pricing new or used equipment? Or monitoring commodity prices? How much time is spent on Twitter or Facebook? How many farmers are using their computers for analysis of yields, soil types, fertility levels and topography, and then generating a comprehensive field map analysis that helps them manage their fields variably?
At the other end of the digital communications spectrum, Ipsos conducted a survey in 2015 and found 86 per cent of commercial farmers read websites and online content for farming while 80 per cent used smartphones.
For all of the positive numbers from surveys though, it’s the anecdotal evidence that Duncan encounters — of an unwillingness to invest time and effort in learning to manipulate data through a computer program — that is most telling. He admits that it does take time for someone to familiarize themselves with the hardware and the software, but beyond the time or any investment costs, there’s the mindset that creates the first barrier.
“It’s a huge paradigm shift,” says Duncan, referring to the generational thinking on many farms. “‘Grandpappy put down blankets, I put down blankets, and we’ve been profitable all these years’. Typically what happens is that the farmer will say, ‘Don’t even talk to me about technology, I don’t want to hear about it’.”
What often happens during that same conversation is that the farmer will direct Duncan or Lepp to talk to their son, who often runs through the make and model of the systems he’s researched — and would love to have. The question at that point is often whether Dad will sign the cheques.
Defining variable rate
If establishing the level of computer adoption and usage rates is a barrier, Duncan contends another important barrier is to define variable rate and show the computational process, and what it means to change from the old paradigm to the new. A simple model of the variable rate computational process includes:
- Gather your data (ideally, multiple years of data).
- Upload into a program.
- Clean the data by removing outliers and unlikely values.
- Grid the values using an interpolation scheme like “kriging”or “nearest neighbour.”
- Apply a classification algorithm to the resulting map that divides the field into management zones.
- Upload soil chemistry/recommendation maps to show nutrient levels in various parts of the field (every four years or so).
- Assess the yields in each zone and begin to create a prescription based on the yield found in the zone.
- Upload your list of fertilizers and nutrients.
- Assign or let an algorithm assign fertilizer values to the zones based on yield and/or current nutrient levels in the zone.
- Capture the resulting prescription map.
- Convert the map scale to match the variable rate spreader you have.
- Upload the prescription to the spreader (usually through a dealer API like John Deere’s APEX).
- Apply the prescription.
- Collect the “as applied” (the actual values the spreader is capable of laying down).
- Compare as-applied maps with prescription maps.
- Adjust applications if needed.
- As you do this year-over-year, keep track of the raw data and generated maps to find usable patterns.
- Back up your data — one day you will realize this stuff is gold.
- Find a secure location for your data SD cards.
- Collect crop with yield monitor to create raw yield map.
- Compare results with as-applied, any additions, and the prescription map.
- Assess financial gains/losses.
- Start at one and adjust levels as needed.
Remember, this is the simple model. Companies such as Trimble and John Deere also recognize the sheer mass of calculations involved that are beyond the capacity of most home computers. That’s why Trimble and Deere offer their services via Cloud-based technology. But it’s important to stress that the PAAO project is based on building a system that does all of this for the farmer and by the farmer. There’s no aggregation or selling of data with this technology. Farmers learn how to use the computer program to build their own analytical tool and recommendations for their own farm.
Getting started the toughest part
At first glance, the crop portal is an impressive sight, with a variety of tables for farmers to input their data. It’s not just a database, however. Lepp emphasizes that it processes yield data and analyzes its place among available details and other information, such as topographical maps or soil test results — whatever a farmer has at their disposal.
“It’s more than just a database, and originally, the PAAO project wanted just a database to drop data, but that wasn’t enough,” says Lepp. “They needed a tool set to look at and process the data, and actually do something with them. The next step was to expand the tool set, to be able to do different calculations on layers and different years of data or work on both elevation and yield data together to create products. That’s what we’re working to expand out into.”

The other aspect that’s important from Lepp’s perspective is what this system provides in terms of visualization. It’s one thing to have a table of soil test results or year-over-year yield data. But when those data points or test results can be combined with a visual guideline or recommendations, that’s when the system begins to attract attention.
Is this complicated? Is it time consuming? Yes — at least in the beginning, concedes Lepp. It’s far more complex than anything else that exists out there — and it’s a system that lets the farmer maintain their own information for their own use. She also agrees that it can be very intimidating, and she’s spent hours talking farmers through the process. Some farmers opt to hire a CCA to do this for them, and that’s great: one way or another, those growers are adopting variable rate technology on to their farms. That they’re hiring a professional to do it in no way diminishes its value or the impact the technology can bring to their farms.
The worst-case alternative is to have all of this information, but not use it to any of its potential. It’s been estimated that more than half of growers with a yield monitor look at the final results, perhaps take a picture of the screen or memorize the numbers, and then hit “delete”. Those are lost opportunities. And investing in new technologies — be they computer-driven or systems that are installed in-cab — may not be as overwhelming as the time needed for a person to familiarize themselves with new technology to the point where it becomes a benefit in terms of on-farm efficiencies.
It’s similar to upgrading from a typewriter to a computer (but on a much larger scale). Is the typewriter simple? Yes. Does the computer take up more time to assimilate and incorporate into a familiar and manageable process? Yes. But in the end, the efficiencies are undeniable. The same is true with smartphone technologies: how many farmers have smartphones that they’ve learned to use? And those took time, as well, but the benefits seemed undeniable.
It’s the same with the PAAO project and its crop portal, but farmers are asking how can they afford to adopt new technology.
But, says Lepp, “At $4 for corn, the farmer can’t afford not to invest, because he’s breaking his back to make $4 — and that’s where we come in. We need to make it fast and painless so the learning curve is almost zero. We’re trying to lower that learning curve to nothing so that it’s easy, it’s quick and they do it almost instantaneously.”
Additional information
The crop portal for the Precision Agriculture for Advancement in Ontario (PAAO) project can be found at cropportal.niagararesearch.ca. It requires a user to register, but if you have questions as to its use and process, you can call Sarah Lepp at 905-735-2211 (ext. 7182) or email [email protected].