The November 2014 soybean futures contract has lost over US$2 per bushel in the past two months. Once prices dropped below $12, a classic chart formation referred to as a head-and-shoulders top was completed and prices quickly plunged to the pattern’s minimum price objective of $11.31.
The head-and-shoulders top is considered the most reliable chart formation for indicating a reversal of the trend and for having the greatest forecasting value.
A head-and-shoulders top is composed of three successive price advances, with the second rally reaching a higher level than either of the other two.
Read Also
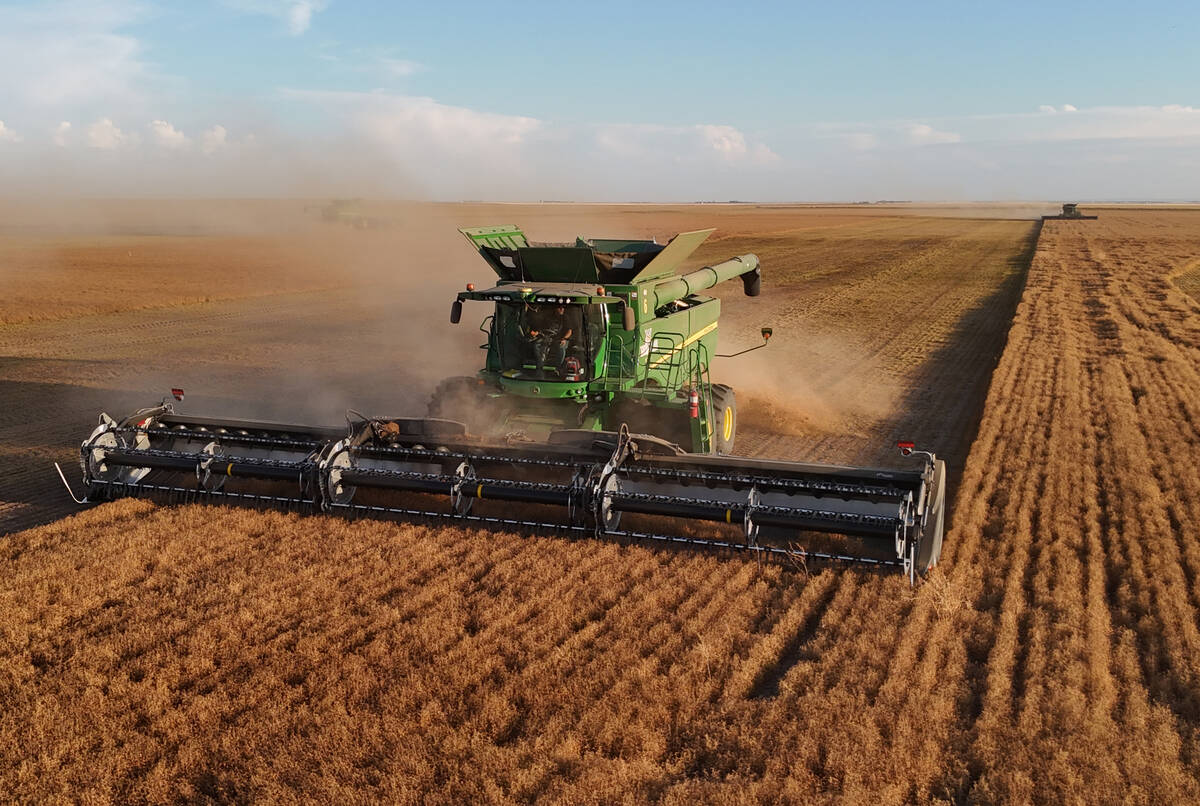
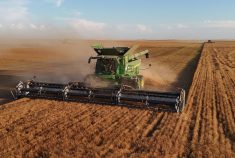
Pulse Weekly: StatCan projects fewer pea and lentil acres
Statistics Canada projected fewer pea and lentil acres to be planted this spring in its initial 2026 planting estimates released on March 5.
The left shoulder — Point A in the accompanying chart — marks the end of a substantial price rise, followed by a downward reaction. In the price rise forming the left shoulder, the trading volume should be higher than in any other phase of the pattern.
Another rally follows which exceeds the left shoulder and forms the head (B). Trading activity is high, but not usually as great as the formation of the left shoulder. A second pullback should culminate at approximately the same price level as the first reaction.
A third rally forms the right shoulder (C), but it fails to get as high as the head. The volume during the formation of the right shoulder must be less than that of either the left shoulder or head or the pattern may be false.
Market psychology: The behaviour of speculative participants during the development of this classic formation is quite predictable. On the advance forming the left shoulder, the shorts are on the run covering their positions, while longs who have been enjoying the ride begin selling to take profits, so trading activity is very heavy.
As the buying and selling subsides, the market undergoes a normal correction which attracts buyers and prices begin moving up again.
When prices on this upward leg surpass the left shoulder, buyers are attracted to the market who not only missed the preceding bull move, but also the opportunity to buy during the decline. This advance forms the head and as prices reach a new high many traders will interpret the move as an indication another substantial price advance has begun. However, the surge of buying climaxes at the head and a second decline begins.
This pullback is seen as another chance to get long, so prices begin to move up for the third and final time.
During the third price advance, it will appear to the longs who are suffering losses that the market is going to bail them out. However, right shoulder highs tend to fall short of expectations, as the buying power has been virtually exhausted.
Never seeing their positions move into the plus column on the third and final advance of the head and shoulders top formation is unsettling to the longs. As prices complete the right shoulder and begin to decline, these longs become willing sellers in order to limit their losses.
When the price drops below the reaction lows, all new long positions are losing money, so the market is poised for the start of a new downward move caused by long liquidation.
The head-and-shoulders pattern is completed when the price penetrates the neckline (D), which is a line drawn from left to right, connecting the bottoms of the two reactions.
After a top is completed, a minimum price objective can be forecasted by measuring the vertical distance from the head to the neckline, then projecting this distance down from the point of the neckline penetration. This price objective is a minimum forecast. The longer the time period required for the head-and-shoulders top formation to form, the greater will be the ensuing move.
Chart formations such as the head-and-shoulders top are reliable tools that farmers are adopting to determine future price direction. Send us your questions or comments about this article and chart.
— David Drozd is president and senior market analyst for Winnipeg-based Ag-Chieve Corp. The opinions expressed are those of the writer and are solely intended to assist readers with a better understanding of technical analysis. Visit Ag-Chieve online for information about our grain marketing advisory service and to see our latest grain market analysis. You can call us toll-free at 1-888-274-3138 for a free consultation.