One year ago, the Canadian dollar was at par with the U.S. dollar. This year the loonie is only worth 94 cents to the U.S. dollar.
Although the weak Canadian dollar makes vacationing in the southern U.S. more expensive, the lower Canadian dollar is supportive to Canadian grain prices.
In reality, though, grain prices in Canada tend to be higher when the Canadian dollar is at par with the U.S. dollar. However, higher grain prices were not a result of the loonie’s strength. Higher grain prices were a result of a low U.S. dollar, which makes U.S. grain more attractive to foreign buyers, which in turn increases demand, draws down stocks and drives up U.S. grain prices. This occurred in the early 1970s and in 2008 when grain prices realigned to new higher trading ranges. In both instances, the Canadian dollar was at par or better.
Read Also
Pulse Weekly: StatCan projects fewer pea and lentil acres
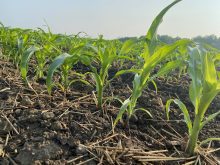
Statistics Canada projected fewer pea and lentil acres to be planted this spring in its initial 2026 planting estimates released on March 5.
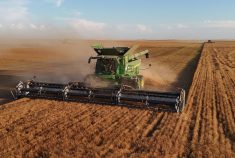
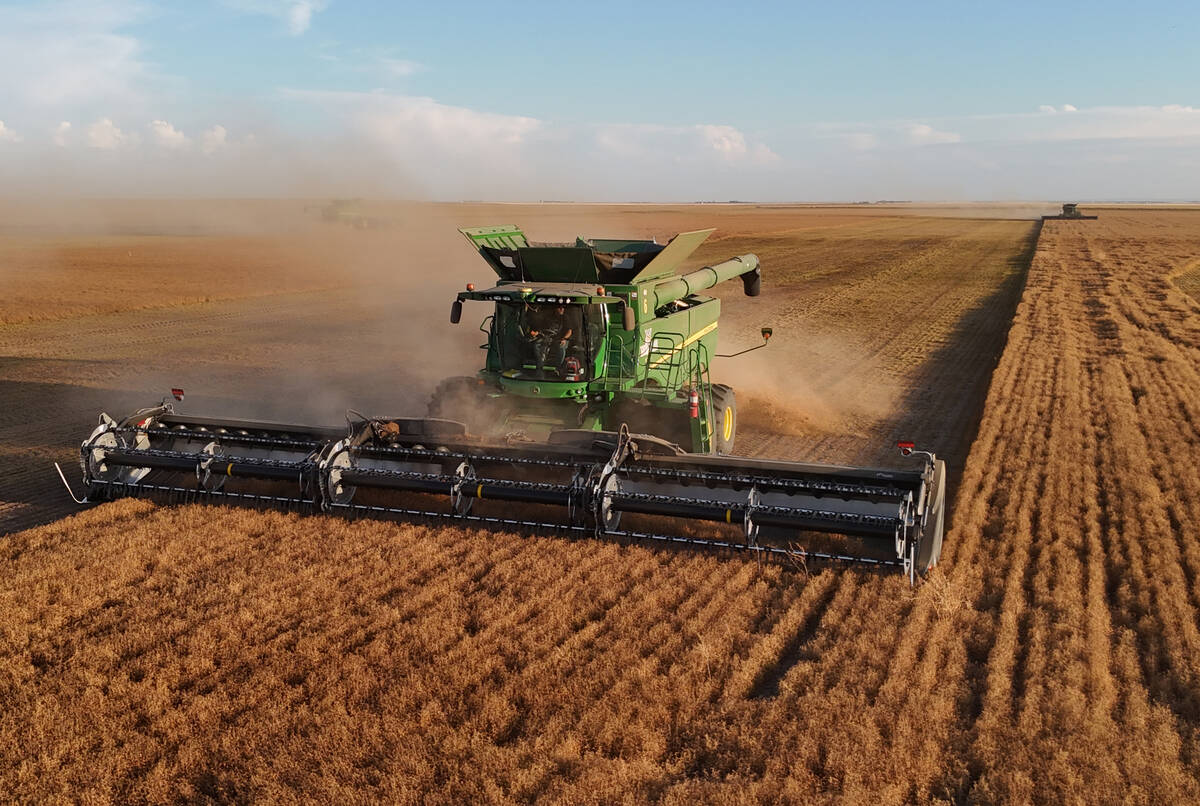
Farmers who are paid in U.S. currency for selling grain and livestock into the U.S. benefit on the exchange rate when the Canadian dollar is low relative to the U.S. dollar.
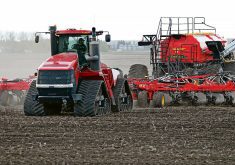
Farmers who are purchasing soybean meal or machinery in the U.S. benefit on the exchange rate when the Canadian dollar is relatively strong against the U.S. dollar. This also applies to those purchasing investment or retirement property in the U.S. and to Canadian snowbirds going south for the winter.
As a farmer, you could encounter both scenarios. In a year like this, you may be getting paid in U.S. currency for selling durum wheat to the U.S. and in another year you may need to convert the Canadian dollar to U.S. currency to pay for equipment purchased in the United States.
Knowing when to convert your money could save you thousands of dollars. Defining areas of support and resistance are useful tools for identifying where a market will change direction or possibly accelerate within the current trend.
Support and resistance
Support and resistance are terms used to describe a price level where the buying or selling of futures contracts is expected to noticeably increase and at least temporarily halt the current direction of the market.
On bar charts these areas will appear as well defined price ranges within which the market traded prior to making a decisive move up or down.
Market psychology: Support and resistance areas evolve because equilibrium is reached between buyers and sellers. The market attracts buying around the bottom of the range and selling in the top portion.
If prices break down through the lower boundary (illustrated as A in the accompanying chart), then all recent buyers will be holding losing positions. Any return move back to this level represents an area in which to liquidate a long position at break-even or with a reduced loss. The offering of contracts for sale at this area also increases, as those who sold in the upper portion of the trading range now have profits and may utilize the bounce to sell more contracts.
Conversely, if the congestion range is resolved by an upside breakout (B), a pullback to this level will encounter increased buying from longs wishing to add to positions acquired near the bottom of the trading range as well as from shorts who having sold in the upper portion of the range are seeking to cut their losses.
Support or resistance areas can help one formulate expectations of future price action. These areas are extremely important as they illustrate where future rallies and declines are likely to fail. As illustrated in the accompanying chart, there were ample opportunities to convert the Canadian dollar to U.S. currency every time the loonie bounced against the line of resistance.
Farmers and livestock producers can certainly benefit from keeping a watchful eye on the Canadian dollar.
Send us your questions or comments about this article and chart.
— David Drozd is president and senior market analyst for Winnipeg-based Ag-Chieve Corp. The opinions expressed are those of the writer and are solely intended to assist readers with a better understanding of technical analysis. Visit Ag-Chieve online for information about our grain marketing advisory service and to see our latest grain market analysis. You can call us toll free at 1-888-274-3138 for a free consultation.