Understand all the numbers in your soil test reports to make your fertilizer plan

When you understand your soil reports, you’re in a better position to develop fertilizer plans with your agronomist. All soil testing labs report the same basic information, but each lab has its own unique format. No matter what your report looks like, first, check the information at the top: your name, address, field name, etc. If this isn’t correct, contact the lab. Then, move on to the other information in the report.
1. Soil pH
The term pH comes from a French term meaning “power of hydrogen.” Soil pH measures hydrogen (H) ions in soil. When soil pH 7.5. The pH range of surface soil is typically between 5.5 and 8.0.
When soil pH is less than 5.5, the soil is very strongly acidic. This can affect legume nitrogen fixation and cause crop toxicity problems with elements such as aluminum or manganese, as these elements are more soluble at lower pH. Low pH can reduce availability of nutrients such as phosphorus. Soil liming may be necessary when soil pH is less than 6.0.
When soil pH is greater than 8.0, availability of some nutrients like phosphorus or metal micronutrients can be reduced. Soil pH greater than 8.3 can indicate a high sodium or sodic soil problem.
2. Soil EC (Electrical Conductivity)

Electrical conductivity measures soluble salts, or salinity level. The units are usually in dS/m (deci Siemens per meter).
EC is determined by measuring the amount of electric current a saturated paste extract of your soil will conduct. Less conductivity means less salt. That’s good.
Ideally, your surface soil should have an EC of not more than 1.0 dS/m. An EC between 1 and 2 is acceptable for most crops.
If your surface soil EC is between 2 and 4 dS/m you have slight to moderate salinity. This can reduce crop yields by 10 to 40 per cent.
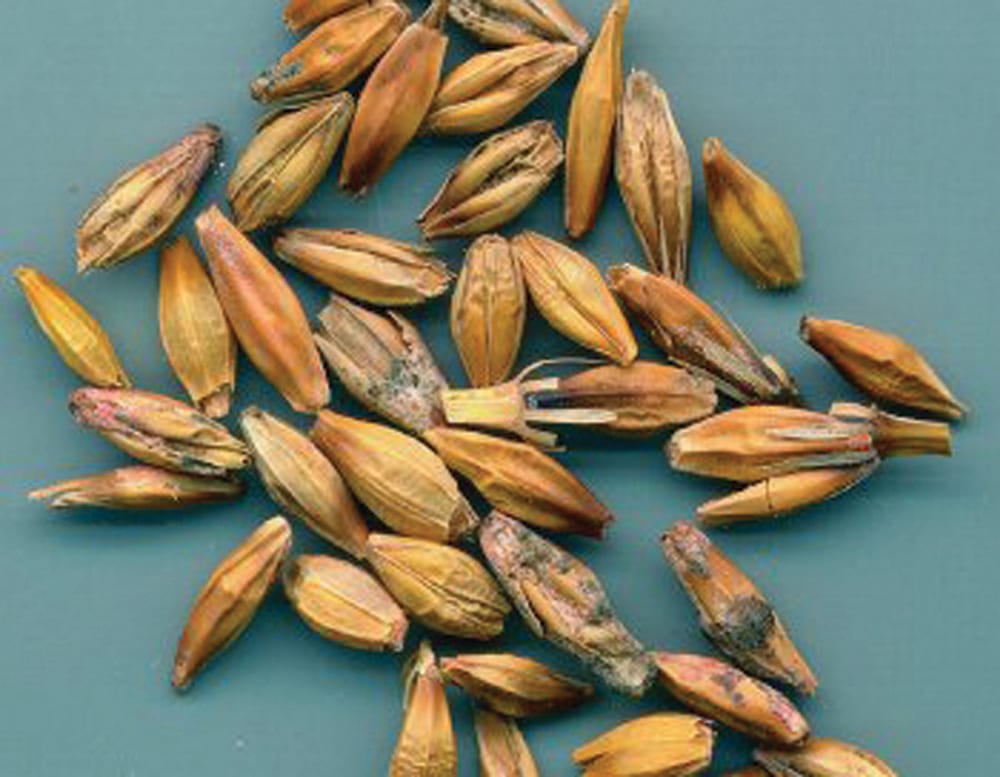
When EC is between 4 and 6 you should only grow salt tolerant crops such as barley.
When EC is greater than 6 dS/m, it might be best to grow salt tolerant forages. Typically, the characteristic white salts on the surface of saline soils are not observed until EC is greater than 8 to 10 dS/m.
Generally, sub soil samples will have some salts, but usually not greater than 4 to 6 dS/m.
3. Percentage of OM (Organic Matter)

Organic matter is the humus in soil that remains after plant and animal residue has initially broken down. OM is an important storage reservoir of nutrients in organic form, which mineralize and breakdown to release available nutrients for plants. Soil OM also improves the physical condition of soil including soil structure, tilth, and water infiltration.
Typical ranges of organic matter are: Brown soils: two to three per cent; Dark Brown: three to five per cent; Black: six to 10 per cent and Gray: two to four per cent.
4. Soil texture

Some reports include this. Soil texture is the relative proportion of sand, silt and clay in a soil. Soil texture is grouped into classes: fine textured soils are higher in clay; course textured soils are higher in sand; medium textured loam soils have about 40 per cent sand, 40 per cent silt and 20 per cent clay.
Soil texture directly affects soil water holding capacity, water infiltration rate and indirectly affects soil fertility.
5. Soil CEC

Some labs measure CEC, the capacity of soil to hold or adsorb positively charged elements called cations, some of which are plant nutrients. The major soil cations include: calcium (Ca2+), magnesium (Mg2+), potassium (K+), sodium (Na+), hydrogen (H+) and aluminum (Al3+).
CEC is strongly affected by soil texture. Soil CEC capacity increases as soil clay content increases. Soil CEC doesn’t change from year to year, so there is no need to measure it annually. Most important, it is not normally needed to develop fertilizer recommendations.
6. Percentage of base saturation (% BS)

Base saturation indicates the amount of negative sites on the soil particles occupied by the base cations (K, Ca, Mg and Na). The other sites are occupied by acidic cations (Al and H).
Some labs give ratios for K:Mg or K:Ca and use these ratios to make K, Ca or Mg fertilizer recommendations. Some agronomists use the “Base-cation saturation ratio” (BCSR) approach to develop fertilizer recommendations. I don’t recommend using the BCSR approach, as research has shown this is seriously flawed for fertilizer recommendations in Western Canada.
7. Macronutrients

The soil nutrient analysis is the heart of the report and should be used as the basis for your fertilizer plan. The major plant available nutrients, macronutrients, are: nitrogen (N) measured as nitrate-N (NO3-N), the form plants take up; phosphorus (P); potassium (K); and sulfate-sulfur (SO4-S).
Some labs also determine calcium (Ca) and magnesium (Mg), but it is extremely rare that these two nutrients are deficient in Western Canadian soils. If you get recommendations for Ca or Mg fertilizer, make sure you get an unbiased second opinion.
Some labs report soil macronutrient levels in parts per million (ppm); some convert to pounds per acre (lb./ac.). To convert ppm nutrient levels to lb./ac., multiply a six-inch depth sample by two, multiply a 12-inch depth sample by four, or multiply an18-inch sample by six.
For example, if soil nitrate-N is 10 ppm and the soil depth sample is six inches: 10 ppm x 2 = 20 lb./ac.
8. Micronutrients

The important micronutrients determined by a soil testing lab are: boron (B), chloride (Cl), copper (Cu), iron (Fe), manganese (Mn) and zinc (Zn). Micronutrient levels are typically reported in ppm.
In my opinion, the soil test for boron is not very reliable. Often, when a soil test indicates low B, applying boron doesn’t increase crop yield. There is a problem with the boron soil test method and calibration for western Canadian soils. It is also my opinion that the soil test for chloride is not very reliable.